Loading...


Google Analytics measures, separates out and then groups users visiting a given website. Users can then be classified according to their demographics, geography and even the devices that are being used. Based on these details, analytical reports can then be filtered, however these filters may not always frame the report as one hopes, in other words, filters are not sufficient to effectively reach the desired information on needs. It is for this reason that Google has created the use of user segmentation to help access this key information in reporting.

User Segments or Segmentation can be defined as a subset of analytics/reporting. Reporting of data belonging to users in a private area is then provided by segmentations. More in depth results can then be obtained by separating the users according to their data, which can then be analyzed. Segments, a subset of analytic reporting, could also be called ‘customized reports’. Each segment helps to report the gathered data in a more usable way.
Segments with an important place in Analytics reports also have an important position for advanced e-commerce analysis. Grouping and defining users within a specific goal allows a lot of data to be analyzed more clearly. Segments allow not only users but also sessions and hits to be grouped. This is an indication that Analytics reports provide a wide range of usable data results. On the basis of which it is possible to make product, category, campaign and event-based analysis thought advanced e-commerce analysis. A segment is created by the application of one or more advanced filters. In the Geography report of Google Analytics, one can see how much traffic coming from a particular city, for example, but if the segmentation is filtered with that city, then the various behaviors of users coming from that city can also be measured. Within a segment, by analyzing the activities of the users from the selected city on a ‘session’ basis. Although not only geographical, all filters used in audience definitions such as age range, adding a product to a cart, technology used, traffic sources can then be applied to segmentation. This makes it possible to fully analyze the presence of any user who has visited the site. Segments show how a deep analysis can be done by using these features.
Segments are used with a certain system in Analytics reports meaning the data does not change. In the opened report, a segment selection is made and the segment filtering can then be analyzed where the data from a specified time interval is shown within this segment. The segment selected (applied) once it has been used in one report it can also then effectively presented in all other reports (unless canceled). A maximum of 4 segments can be applied at any time. The implementation of more than 4 segments is both limited by Google Analytics and using more will harm the analysis as it can cause an intense data cluttering. Reports are initially by default presented without segments included. Segment selection is then added after that by using the "Add Segment" button at the top of the report.

Clicking the "Add Segment" button opens a list containing various segments. This drop-down list contains previously defined segments. If no segment is defined in the current view used, defining and making a new segment is by using the "+ New Segment" button at the top of the list. Segment definition is done in the same way as can define dynamic remarketing audiences. We will write a more detailed blog defining dynamic remarketing audiences here soon.
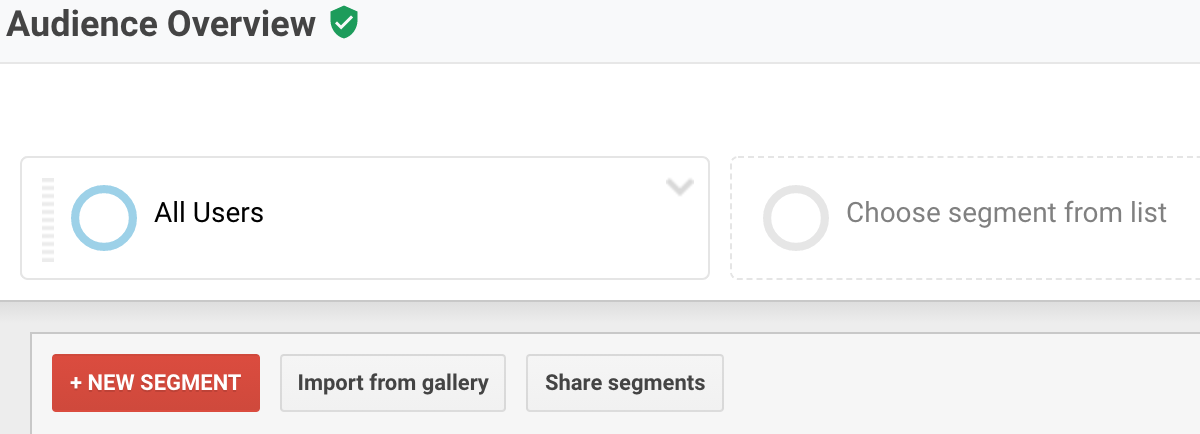
In the same way that we make new segments by clicking the "+ New Segment" button on the report pages, we can also do the same from the "Admin" panel. Under the "View" column in the "Manager" panel, the "Segments" option is a way to access all segments and make and define new segments. If there are no segments showing, then new segments can be created from scratch, or new segments that have been defined in another view can be added and used with the help of the "Import from Gallery" button.

After clicking the "Add Segment" button, a segment can then be selected from the drop-down list. This selected segment is then applied to an Analytics report. The segment list can be divided into various categories and using these categories, multiple segments can be easily found. One way to find segments is to mark a favorite segment with an asterisk next to its name. By doing this, previously searched segments can be easily found and used from the segment list. It should be noted that a maximum of 100 segments can be defined in the view under an account without Analytics 360 membership.

Once a segment is selected it is then applied to the report with the "Apply" button and the data in the report is filtered according to the applied segment and becomes more meaningful and understandable data.
The word segmentation, is now such a frequently used term in the field of marketing, it is an inextricable part of our lives, WHY? Because it provides some of the most usable, detailed reporting and analysis we can access. In order to decipher the usable data available to us… we need to use something that can order and give a user shape to help us, we call this a segment!

COVID-19 also infected the SEO and affected the SEO performance of brands. Things that changed in SEO strategies with the effect of coronavi...
COVID-19 also infected the SEO and affected the SEO performance of brands. Things that changed in SEO strategies with the effect of coronavi...
 Popular Articles
Well, why are the H1 tags so important for SEO? How to use heading tags which range in number from 1 to 6? You can find the correct answers...

Lazy loading is a technique used to optimize what is seen by your client. It might be a little confusing to some because Lazy Loading causes...

How do you recognize URL parameters and use them to benefit your site without being penalized by search engines? We’re here to answer your q...

Structure data is the coding you input into your webpage field when you are creating it.